
Many sales dashboards aren’t very effective. To assess whether you’re on track to meet your monthly goals, you shouldn’t have to analyze data as complicated as the controls on a spaceship. Displays hundreds of metrics must be frustrating to the point of checking your own pipeline sheet instead. This scenario is much more common than you’d expect.
Focus is the missing piece. If you’re trying to track everything, you’re really not tracking anything. To help you sort through the confusion of what to really track, I have compiled a short and precise list of metrics most sales leaders agree provide the most value in assessing your sales performance on a monthly basis. Let’s make a functional dashboard.
The Foundation: The “Why” Behind the Metrics
Every time we display some numbers, the first thing we should remember is that without context, the numbers mean nothing. The important thing is not to just look at the numbers but to see what they reveal about the workings of your system. Are your leads qualified? Is your team working with maximum efficiency? Is your pipeline healthy?
At a glance, your dashboard should be able to answer these.
The Essential Metrics Your Dashboard Needs
The following are the most important metrics that give the clearest picture organized by the different stages of the sales journey
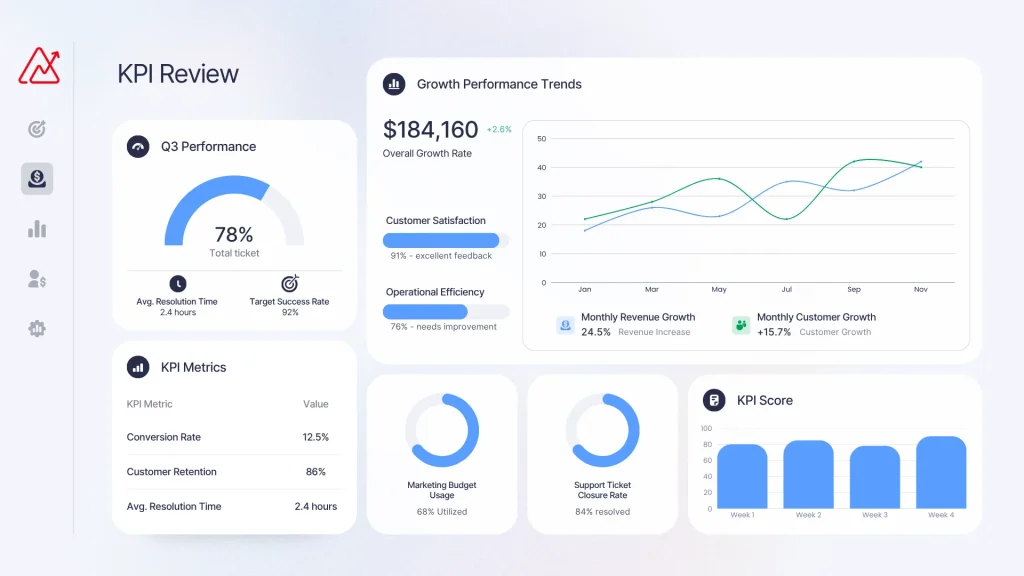
1. Lead Generation & Quality
- Number of New Leads: The most basic input. Is your marketing generating traffic? Is your outreach working? A decline in this number is an early warning sign.
- Lead-to-Opportunity Conversion Rate: This is the place where you begin to measure the quality of leads. How many of these leads are actually qualified and become real sales opportunities? If this number is deficient, there is a lead quality issue or a problem with initial follow-up. You are trying to fill a leaky bucket.
2. Pipeline Health & Velocity
This is the heart of your sales operation. Your pipeline is your crystal ball.
- Pipeline Value: The total dollar amount of all your open opportunities. This is your future revenue potential. You want this to be 3-4x your sales quota to give you a safe buffer.
- Sales Velocity: This might be the most important metric you’re not tracking closely enough. It tells you not just how much you’re selling, but how fast. The formula is:
(Number of Opportunities x Deal Value x Win Rate) / Sales Cycle Length - Why it’s a game-changer: Improving any one of these four factors makes your entire team more productive. A higher velocity means you’re generating revenue faster and more efficiently.
3. Sales Activity & Efficiency
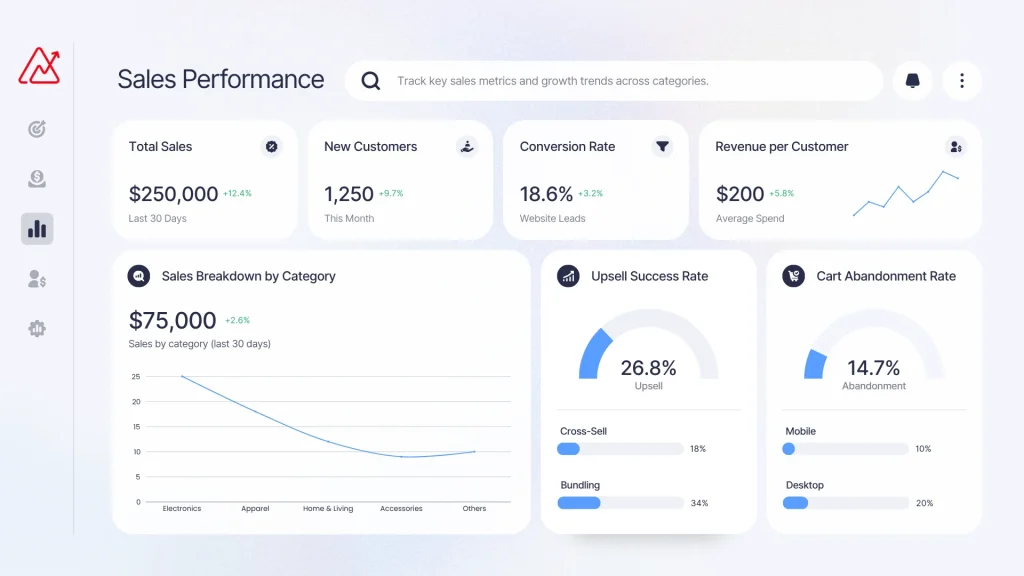
Results are always the output of activity. A lack of activity, especially, an activity plan deficit, spells more results and revenue loss.
- Activities per Rep is a combination of calls, emails, and meetings. It is a pulse effort activity gauge that can warn of motivational problems or process issues if the results are lacked.
- Average Sales Cycle Length: How long does it take to close a deal? You need to understand this to forecast correctly. If it’s taking longer to close a deal, it could either be because a deal is getting more complex or there’s some friction within your process.
4. Closing & Performance
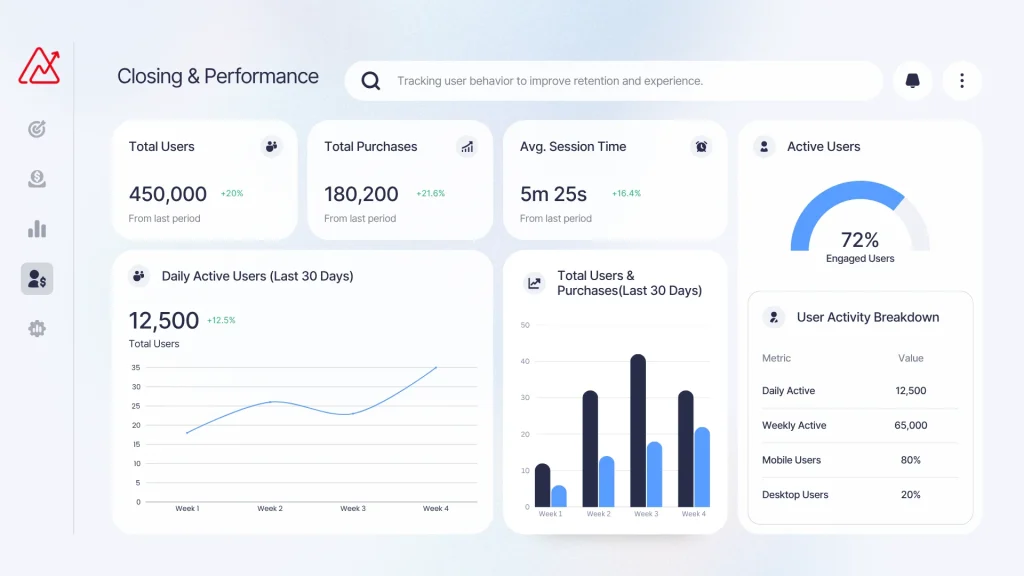
This is the bottom line. These metrics tell you if your strategy is working.
- Win Rate (Overall and by Rep): What percentage of your opportunities are you actually closing? Track this for the team and for individuals. It helps you identify your top performers and understand what makes them successful.
- Average Deal Size: Is your business built on a few big deals or many small ones? You need to know this to forecast and strategize. If you want to grow, you need a strategy to grow your average deal size or the number of deals you close.
- Sales Target vs. Actual: This is the most straightforward and ruthless number. Is everything on schedule? This is the most important number for the entire company.
Bringing It All Together: From Spreadsheet Chaos to Clear Insight

There is a difference between understanding the metrics and actually building a quality, real-time dashboard that your team will use. This is where a product like Zoho Analytics comes to the rescue.
What makes it work so well for this purpose?
- All-Inclusive Integration: Your data is likely siloed in different locations—CRMs (Zoho CRM, Salesforce, HubSpot), spreadsheets, and various marketing applications. Zoho Analytics saves time because it automatically integrates and analyzes your data, no manual exports or copy-paste data transfers every week.
- Single Source of the Truth: Consider a dashboard that calculates key metrics (like sales velocity, pipeline value, and win rate) in real time. This feature of Zoho Analytics removes the discrepancies in data and allows your team to concentrate on the same goal.
- Designed for Storytelling: Zoho Analytics goes beyond just displaying data and focuses on building a narrative. For example, you can track the decline in lead quality and subsequently see the impact on pipeline value two months later. You can create personal dashboards for reps that focus on their individual activity and goals and managers can get another that focuses on team performance and forecasts.
A Zoho dashboard could consist of three key components, for instance:
- Achievements Showcase: Each rep’s progress towards their quotas in an achievement showcase. It’s friendly competition!
- A Pipeline View: Total pipeline value and progress breakdown. You can see what deals are stuck and their current stages.
- Velocity Monitoring: A chart showing your sales velocity and how it changes over time. You can see how your process changes and how it impacts your sales velocity.
Your Action Plan

Tracking 50 metrics is overkill. When metrics don’t make sense and it’s time to cut. A few metrics is enough.
- Examine your current dashboard: Remove any chart or number that doesn’t help make a decision this week.
- Use these expert-recommended metrics: Center your reports and conversations around them.
- Use appropriate software: If you are spending more time building reports than analyzing them, try Zoho Analytics, which can help save you time.
Sales dashboards are designed to help you make quicker, smarter decisions. They should reflect your sales health and should help you determine what is important and what is just excess.

