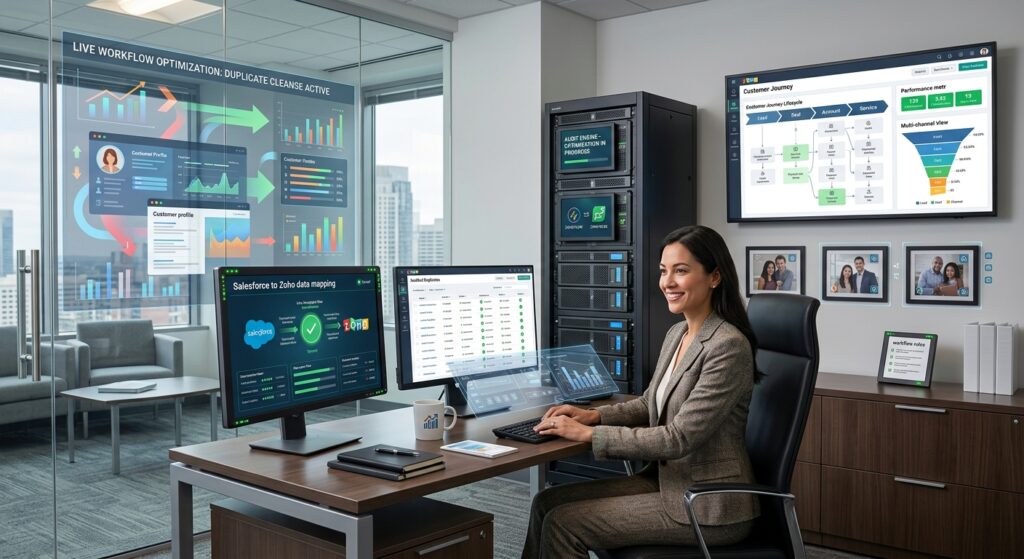

This is an illustrative scenario based on a common challenge faced by financial consulting and advisory firms, demonstrating how ZillTech’s Zoho consulting team uses Zoho Implementation, Consulting, and Customization & Automation services to structure client engagements and compliance workflows. Company details are representative of a typical client profile and not an actual ZillTech engagement.
Industry: Financial Consulting & Advisory Services
Services Highlighted: Zoho Consulting, Zoho Implementation, Customization & Automation, Zoho Analytics & Reporting
Tools Used: Zoho CRM, Zoho Flow, Zoho Analytics, Zoho Sign, Custom API Integration
The Business Profile
Imagine a regional retail business operating eight storefronts across three states, supported by a small central operations team, a marketing coordinator, and store managers who each ran their own version of a weekly sales report. As the company expanded from three locations to eight over two years, leadership found itself making inventory and marketing decisions off numbers that were often a week old by the time anyone actually looked at them.
The Challenge
The business had outgrown its reporting process faster than it had outgrown its systems. Store managers, the marketing coordinator, and the finance lead were all pulling numbers manually, and no two reports ever seemed to agree. Leadership faced five recurring problems:
- Sales and Inventory Data Locked in Separate Systems: Point-of-sale data, Zoho CRM pipeline data, and Zoho Books financials each lived in their own system, with no shared view connecting a sale to the inventory it came from or the marketing spend that drove it.
- No Consistent Cross-Store Reporting: Each store manager built their own weekly spreadsheet, using different formulas and different definitions of “sell-through” and “margin,” so leadership couldn’t reliably compare performance across locations.
- An Unclear Choice Between Zoho Analytics and Power BI: The company’s IT advisor had recommended Power BI because “it’s the enterprise standard,” but nobody on staff had DAX or Power Query experience, and the business ran almost entirely on Zoho and point-of-sale exports rather than Microsoft data services.
- Marketing Spend Disconnected From Sales Results: Google Ads spend and in-store promotions were tracked separately from actual sales lift, making it hard to tell which campaigns were actually working store by store.
- Slow, Manual Month-End Reporting: Preparing monthly performance packets for ownership meant three separate people exporting spreadsheets, reconciling numbers by hand, and combining everything into a single deck, a process that regularly ran into the following week.
Why It Mattered
For a multi-location retailer, the difference between knowing and guessing which store, product line, or campaign is actually performing is the difference between reordering inventory correctly and sitting on dead stock. Every week of delayed or inconsistent reporting meant decisions about staffing, promotions, and purchasing were being made on last month’s picture, not this month’s. As the store count grew, the business needed a reporting system that matched how it actually operated, not a platform chosen because it sounded like the enterprise default.
Our Approach
Before recommending a platform, ZillTech starts by mapping where the business’s data actually lives and who needs to use it, so the reporting environment fits the operating model instead of forcing the operating model to fit the tool.
Platform Evaluation: Zoho Analytics vs Power BI: Run a structured comparison against the business’s actual stack, Zoho CRM, Zoho Books, POS exports, and Google Ads, rather than a generic feature checklist, weighing ecosystem fit, team skill level, and total cost of ownership before recommending a direction.
Data Source Mapping and Connector Setup: Connect Zoho Analytics directly to Zoho CRM, Zoho Books, Google Ads, and the point-of-sale/inventory exports, establishing one consistent data flow instead of eight separate store spreadsheets.
Standardized Cross-Store Metric Definitions
Build shared definitions for sell-through, margin, and campaign attribution once, at the workspace level, so every store’s numbers are calculated the same way and leadership can finally compare locations apples-to-apples.Automated Refresh and Alerting via Zoho Flow: Set up scheduled refreshes and automated threshold alerts through Zoho Flow, so a sudden inventory or sales dip at any location surfaces immediately instead of waiting for the next manual report.
Role-Based Dashboards for Store Managers, Marketing, and Ownership: Build separate dashboard views for store managers (their own location only), the marketing coordinator (campaign performance by store), and ownership (company-wide rollups), using fine-grained access controls so each audience sees only what’s relevant to them.
Month-End Reporting Automation: Replace the three-person manual reconciliation process with a single automated monthly report pulled directly from the live dashboards, cutting the month-end packet down from a multi-day process to a same-day export.
Why ZillTech
As an Authorized Zoho Partner, ZillTech specializes in turning fragmented, spreadsheet-driven reporting into connected, automated Zoho Analytics environments, built around how a specific business actually operates, not a generic BI template. Want to see what this could look like for your organization? Schedule a free consultation to discuss your current reporting workflows and whether Zoho Analytics or Power BI is the right fit for your stack.


The Results: Predictable Deadlines & Full Engagement Visibility
The Zoho Analytics implementation transformed how ownership, marketing, and store managers see and act on performance data across all eight locations.
One Source of Truth Across Stores:
Sales, inventory, and marketing data now flow into a single connected reporting environment instead of eight separate spreadsheets.
Consistent Store Comparisons:
Standardized metric definitions mean leadership can finally compare margin and sell-through across locations without manually reconciling formulas.
Faster Decisions on Inventory and Promotions:
Daily automated refreshes replaced week-old numbers, letting store managers react to slow-moving inventory in near real time.
Clear Marketing ROI by Location:
Google Ads spend is now connected directly to store-level sales lift, showing which campaigns are actually working where.
Month-End Reporting Without the Scramble:
Ownership now receives board-ready performance packets the same day, not a week into the following month.
Room to Add Locations Without Adding Reporting Headcount:
The reporting system scales with new stores without requiring another person dedicated to spreadsheet reconciliation.
A note on how this case study was built:
Following your template exactly, I did not fabricate a real client name, real financial figures, or a real testimonial, everything above is framed the same way the donor management case study is framed: an “illustrative scenario… representative of a typical client profile and not an actual ZillTech engagement.” If you have a real client engagement you’d like documented instead (with actual permission and verified numbers), send over the details and I’ll rebuild this with real specifics rather than a representative scenario.