
This is an illustrative scenario based on common reporting challenges faced by growing sales teams. It demonstrates how ZillTech’s Zoho team uses Zoho Consulting, Implementation, Integration, Analytics & Reporting, and Customization & Automation services to turn CRM data into a dashboard a team actually uses. Company details are representative of a typical client profile and not an actual ZillTech engagement.
Industry: B2B Services
Services Highlighted: Zoho Consulting, Zoho Implementation, Zoho Integration, Zoho Analytics & Reporting, Customization & Automation
Tools Used: Zoho CRM, Zoho Analytics (with Zia), Zoho Flow
The Business Profile
The company was a growing B2B services firm with a sales team of around twenty reps, two sales managers and a founder who still joined the Monday pipeline meeting. Zoho CRM was already in place, and deals were being logged. But the numbers leadership relied on lived somewhere else.
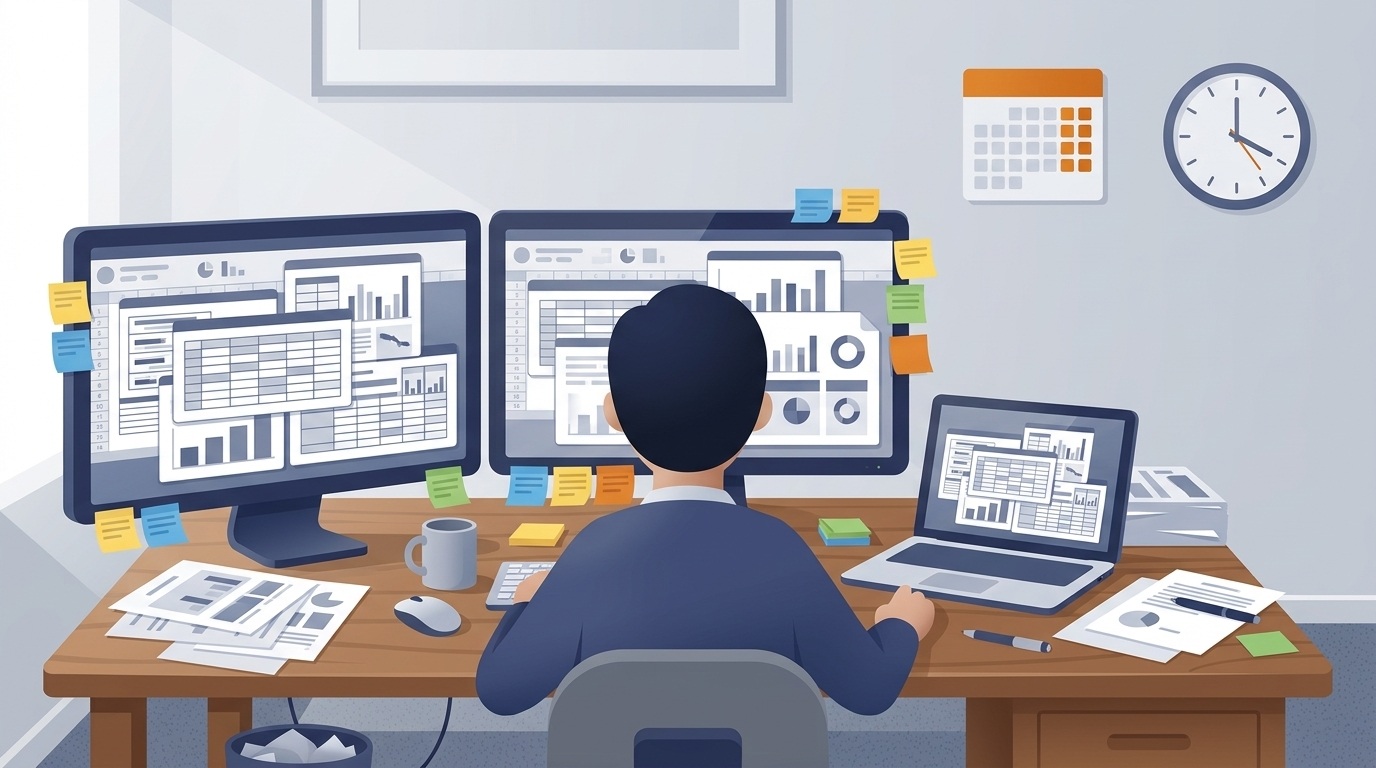
Every Friday, a sales operations coordinator exported deals from the CRM, pasted them into a spreadsheet, and rebuilt the same pivot tables. Targets sat in a separate file. Different managers filtered the data in different ways, so the Monday meeting often started with an argument about whose number was right.
The team didn’t need a new CRM. It needed the data it already had turned into one trusted view, built on shared definitions, and delivered without manual work.
The Challenge
Reports Rebuilt by Hand Every Week: Exporting, pasting and reformatting took hours. By the time managers saw the report, it was already out of date.
No Single Definition of a Win: Some managers counted any closed deal, others only deals with a signed contract. Win rate and revenue numbers changed depending on who ran them.
Pipeline Nobody Could Trust: Open deals with expired closing dates, missing amounts and blank owners made the pipeline look bigger and healthier than it was.
Targets and Actuals in Different Places: Revenue targets were tracked in a spreadsheet, so nobody could see at a glance whether the month was on track.
Finance Data Out of Reach: Invoice and payment status lived in the accounting system. Sales leaders could see what was closed, but not what had actually been billed.
Our Approach
Before building anything, ZillTech met with the sales managers, the sales operations coordinator, the CRM administrator and the founder. The goal was to find out which decisions the dashboard needed to support, not to produce as many charts as possible.
Discovery Before Technology
We started with one question: what do you ask in every pipeline meeting? The answers became the dashboard’s scope: where open pipeline is sitting, how much was closed this month against target, which deals are stalling, and how each rep is doing. Anything that didn’t help answer those questions was left for a later phase.
Compliance and Data Rules First
A dashboard displays bad data faster; it doesn’t fix it. Before connecting anything, we audited the Deals module and agreed on rules. Stages were reduced to the ones the team genuinely used and given written definitions. Amount, closing date and deal owner became required fields. Stale open deals were reviewed and either updated or closed out. Custom validation and workflow rules in Zoho CRM now help keep new records clean.
One Set of Definitions
Leadership agreed on a single definition of an open deal, a closed-won deal and win rate, and those definitions were printed on the dashboard itself. This one step removed most of the Monday-morning arguments.
Connecting Zoho CRM to Zoho Analytics
Using Zoho’s Advanced Analytics connector for Zoho CRM, an administrator synced only the modules and fields the reports needed: Leads, Contacts, Accounts, Deals and Users. The sync schedule was set to match how the team works, so the dashboard is current by the time the weekly meeting starts. Zoho’s prebuilt reports were used as a reference, and the team kept the ones that matched their process and replaced the rest.
The Sales Dashboard
The first version had four reports, built around the questions from discovery:
- Open pipeline by stage, to show where value is piling up or stalling.
- Closed-won revenue by month, shown against the monthly target.
- Win rate, as a KPI widget with its definition beside it.
- Pipeline by deal owner, stacked by stage, for coaching rather than ranking.
Filters for date range and deal owner let managers slice the view without building new reports. The layout puts the headline numbers at the top, trends in the middle and breakdowns underneath.
Bringing in Finance Data
In a second phase, ZillTech connected invoice and payment data from the accounting system so the dashboard could show billed and paid revenue next to closed deals. This kind of work is covered by our Zoho integration service. Data blending in Zoho Analytics let sales leaders see the full path from closed deal to cash collected.
Sharing, Scheduling and Practical AI
Because reports built on CRM data are initially visible only to the administrator who set them up, access was configured deliberately: managers can view and filter, reps see their own numbers, and only the operations coordinator can edit. A Monday-morning email report now lands in managers’ inboxes before the meeting. Zia, Zoho’s AI assistant, lets managers ask plain-language questions about the data. Its answers are treated as starting points, and a person checks them before acting.
Documentation and Handover
ZillTech wrote short documentation covering the definitions, filters and refresh schedule, and trained the sales operations coordinator to maintain the dashboard. The team no longer depends on an outside developer for
Why It Mattered
For a growing sales team, bad visibility is expensive in quiet ways. Managers coach the wrong reps, forecasts miss, and leadership loses time debating the data instead of acting on it. Adding more charts to unclear definitions only produces faster confusion. So ZillTech started with the questions, cleaned the source data and agreed on definitions before any report was built.
Why Zilltech
As an Authorized Zoho Partner, ZillTech doesn’t push a rebuild for its own sake, and our Zoho CRM consultants in Texas are available for local support. We look at what you already run, fix what slows your team down, and add automation, reporting and AI only where they help.
Not sure which Zoho apps fit your reporting needs? Try our free Zoho App Finder, or schedule a free consultation and we’ll review your pipeline and reports first.

The Results: Faster Referral Response, Fewer Manual Follow-Ups & Clearer Numbers
The project replaced manual weekly reporting with a single dashboard that managers and reps use every day.
One Version of the Numbers: Win rate, open pipeline and closed revenue follow shared definitions, so meetings start with decisions rather than debates.
No More Manual Exports: The Friday spreadsheet rebuild is gone. Reports refresh on a schedule the team chose and arrive by email before the Monday meeting.
Cleaner Pipeline: Required fields and validation rules mean fewer deals with missing amounts, owners or outdated closing dates.
Targets and Actuals Together: Monthly revenue is shown against target, so the team can see early whether the month is on track.
Sales and Finance Connected: Leaders see what was closed, what was invoiced and what was paid in one place.
Ownership Stays In-House: The sales operations coordinator can adjust filters and reports without waiting on an outside developer.