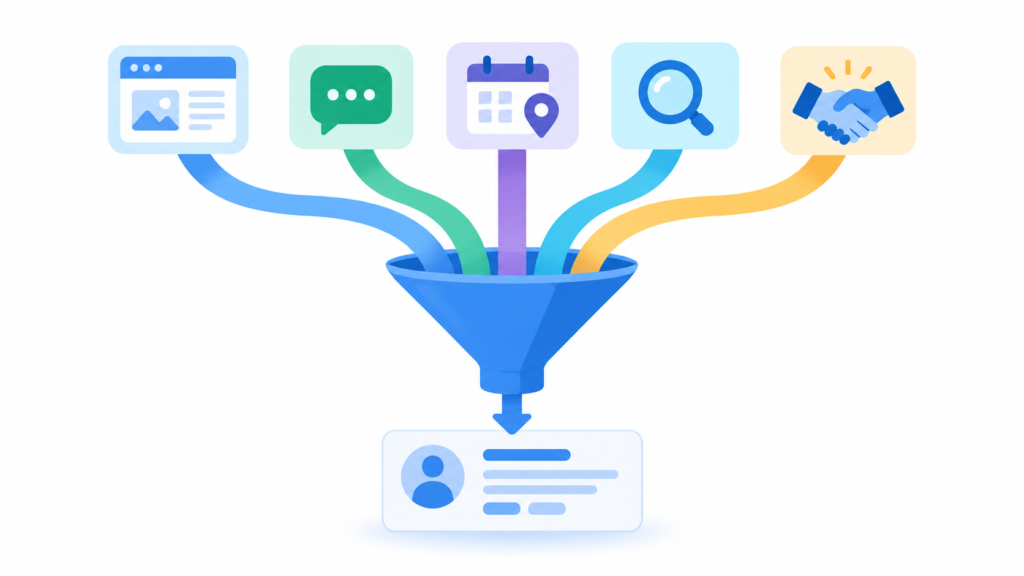

Focus is the missing piece. If you’re trying to track everything, you’re really not tracking anything. To help you sort through the confusion of what to really track, I have compiled a short and precise list of metrics most sales leaders agree provide the most value in assessing your sales performance on a monthly basis.
Want a sales dashboard that actually drives decisions instead of creating reporting chaos? Explore our services to build a streamlined, conversion-focused analytics setup that gives your team clear visibility and measurable growth.
Let’s make a functional dashboard.
The Foundation: The “Why” Behind the Metrics
Every time we display some numbers, the first thing we should remember is that without context, the numbers mean nothing. The important thing is not to just look at the numbers but to see what they reveal about the workings of your system. Are your leads qualified? Is your team working with maximum efficiency? Is your pipeline healthy?
At a glance, your dashboard should be able to answer these.
📊 Is Your Sales Dashboard Actually Helping You Close Deals?
Stop drowning in data noise. Get a customized, clutter-free dashboard designed specifically for your sales workflows to accurately predict revenue and track what truly matters.
The Essential Metrics Your Dashboard Needs
The following are the most important metrics that give the clearest picture organized by the different stages of the sales journey.

To implement these metrics properly and eliminate data chaos across your entire organization, you need a robust foundation. Reading the ultimate Zoho CRM implementation guide can help you correctly configure your pipelines from day one, ensuring your reporting tools capture clean, reliable inputs.
1. Top-of-Funnel Health Metrics
Understanding lead generation and acquisition velocity is crucial for anticipating future pipeline success. You should focus heavily on lead response times and source profitability to maximize your investments.
Average Lead Conversion Rate by Source
2. Pipeline Performance and Pipeline Velocity
Tracking the structural execution of your sales stages keeps deals from stalling out indefinitely. Monitoring stage-by-stage conversions helps pinpoint exactly where bottlenecks occur within your pipeline.
For organizations transitioning away from disjointed tracking sheets, migrating from legacy systems like QuickBooks or Excel into an automated framework is an absolute necessity to measure velocity accurately.
| Sales Funnel Stage | Target Conversion Rate | Ideal Metric Impact |
|---|---|---|
| Lead to Qualified Opportunity | 35% – 45% | High Quality Filter |
| Opportunity to Proposal Sent | 50% – 60% | Active Evaluation |
| Proposal Sent to Closed-Won | 20% – 30% | Revenue Generation |
When default pipelines fail to map your real-world activities cleanly, deploying an advanced visual framework is the solution. If your process feels chaotic, utilizing Zoho CRM Blueprint functionality forces predictable stage navigation directly within your metrics platform.
3. Real Business Intelligence and Revenue Forecasting
Modern commercial performance relies on highly reliable forecasting metrics to manage resource allocation safely. Many leaders erroneously assume sophisticated reporting suites require extensive enterprise funding models.
However, if you think you can’t afford real business intelligence, think again. Streamlined data extraction ecosystems make predictive visualization accessible for scaling teams without breaking your budget.
Ultimately, a dashboard shouldn’t be a vanity display. It should serve as a practical, reliable operating system that clearly alerts your leadership when workflows require structural adjustments.