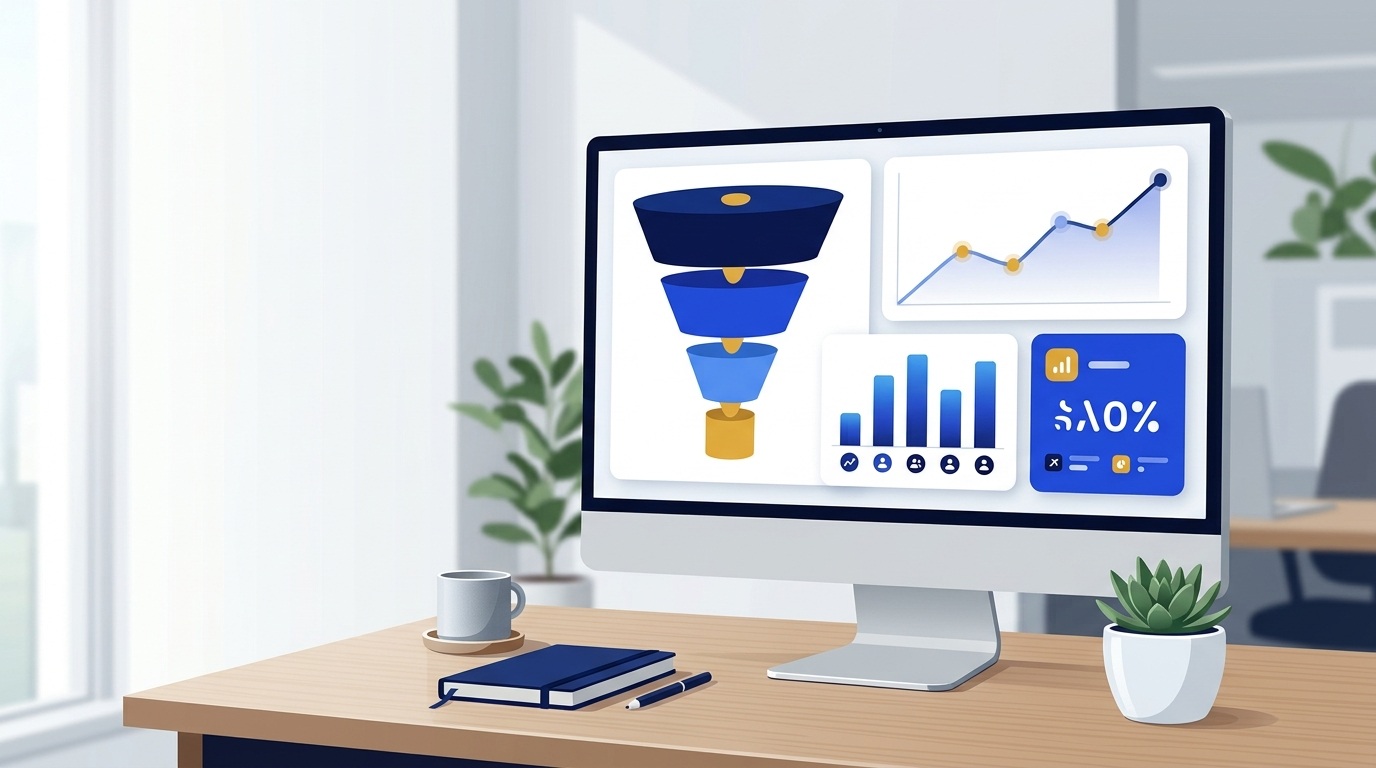
Most sales teams don’t have a data shortage. They have a visibility problem. Deals sit in Zoho CRM, targets live in a spreadsheet, and the weekly pipeline review turns into someone scrolling through records and guessing. A well-built Zoho Analytics dashboard fixes that by putting the numbers your team actually acts on, such as pipeline by stage, revenue by month and win rate, on one screen that refreshes on its own.
This guide walks you through building your first sales report and dashboard from scratch: how to connect Zoho CRM, check your data, build four starter reports, combine them into one dashboard, and share it with your team. You don’t need to write code or have a BI background. If you’re still deciding how CRM fits into your sales process, our guide on what Zoho CRM does for sales teams is a good place to start.
Quick answer: To build a sales dashboard in Zoho Analytics, connect Zoho CRM through the Advanced Analytics connector, choose the modules and fields to sync, create a few focused reports (pipeline by stage, revenue over time, win rate, performance by owner), add them to a dashboard, and then share it or schedule it by email.
What is a Zoho Analytics dashboard?
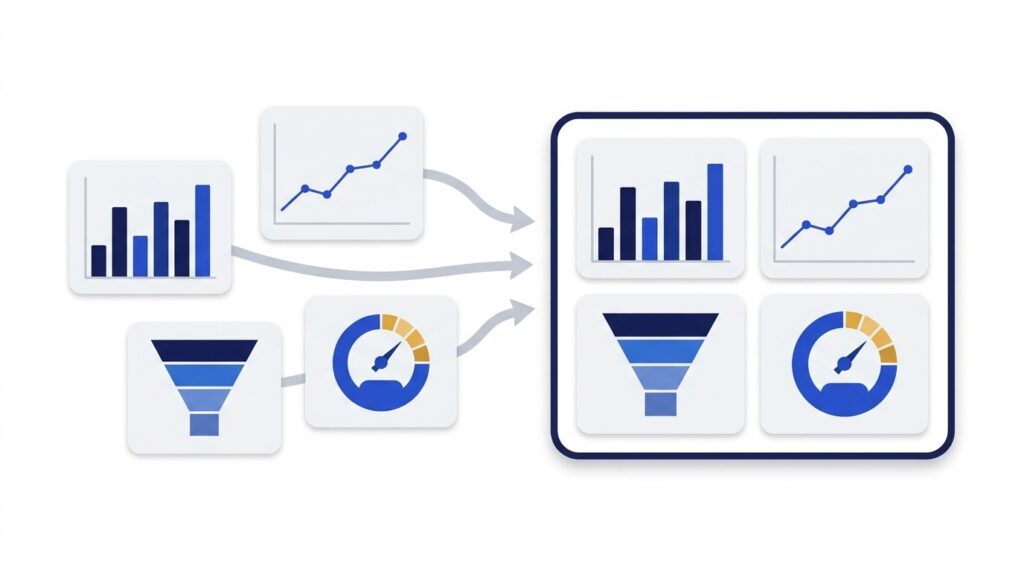
A dashboard in Zoho Analytics is a single page that holds several reports, such as charts, pivot tables, summary views and KPI widgets, so you can read them side by side. Each report answers one narrow question. The dashboard answers the bigger one: how is sales doing right now?
Zoho CRM has its own reporting, and for simple lists and filters it works well. Analytics becomes useful when you want more flexible visuals or want to combine CRM data with other sources. Zoho’s sales dashboard page highlights data blending with marketing, finance and support data, scheduled email reports, and the option to embed live dashboards in your CRM, intranet or client portal. It also lists more than 100 integrations, so the CRM is not the only thing you can connect later.
For your first dashboard, though, keep the scope small. One data source (Zoho CRM), four reports, one audience.
What you need before you start
- Zoho CRM with real deal data. A dashboard built on three test deals teaches you nothing. A few weeks or months of genuine activity is enough.
- Admin access. Zoho’s documentation says users with administrative privileges can set up the CRM connector, so you may need your CRM admin to do the connection step.
- A Zoho Analytics plan or trial. Zoho’s CRM help notes that you can evaluate the Advanced Analytics add-on on a 15-day trial, and that continuing means upgrading to a paid Analytics plan. Plans and prices change, so check Zoho’s current pricing page before you commit. We cover the wider picture in our Zoho cost breakdown.
- Agreed deal stages. If your team can’t say what Qualification or Negotiation means, no dashboard will fix that. Settle the definitions first.
Step 1: Decide what your first report should answer
The most common reason first dashboards fail is that they start with the tool instead of the question. Before you open Analytics, write down the one or two questions your sales manager asks every week. For example:
- How much open pipeline do we have, and where is it stuck?
- Are we on track to hit this month’s revenue target?
- Which reps or lead sources produce the deals we actually close?
A simple test for every report you plan to build: would anyone change what they do on Monday because of this chart? If not, leave it out. You can always add it later.
Step 2: Connect Zoho CRM to Zoho Analytics
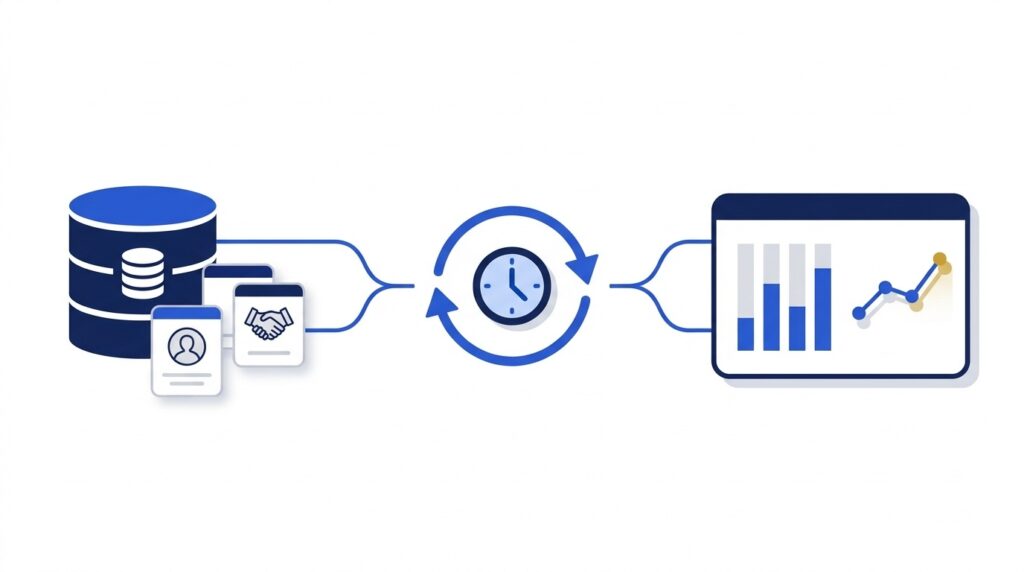
The fastest route is Zoho’s own connector, called Advanced Analytics for Zoho CRM. According to Zoho’s Analytics help, it ships with more than 100 prebuilt reports and dashboards over your CRM data, so you get something to look at straight away.
The setup flow, as described in Zoho CRM’s integration guide, looks like this:
- Log in to Zoho CRM as an administrator.
- Open the Reports tab and click Advanced Analytics for CRM. It opens Zoho Analytics in a new browser tab.
- In the configuration dialog, select the CRM modules and fields you want to sync. Mandatory fields are preselected and can’t be cleared.
- Choose a sync option. Zoho lists options such as every 3 hours, every 6 hours, every 12 hours or daily, with the Basic edition limited to daily.
- Click Save and let the first import finish.
A few details from Zoho’s documentation are worth knowing before you click through:
- You can sync up to 95 fields per module, so don’t tick every box. Pick the fields that feed your reports.
- Reports created from CRM data are initially visible only to the administrator who configured the add-on, so you’ll need to share them (we cover that in Step 6).
- Later changes to CRM records are synchronized at the scheduled sync time, which means your dashboard is only as fresh as your sync setting.
Zoho updates its interface from time to time, so button labels may differ slightly from what you see. The linked help pages are the source of truth if something has moved.
For a first sales dashboard, sync Leads, Contacts, Accounts, Deals and Users. Those five cover nearly every sales question you’re likely to ask in month one. If you later need to pull in invoices, tickets or marketing data, that’s a job for a proper Zoho integration rather than a quick fix.
Step 3: Check your data before you chart it
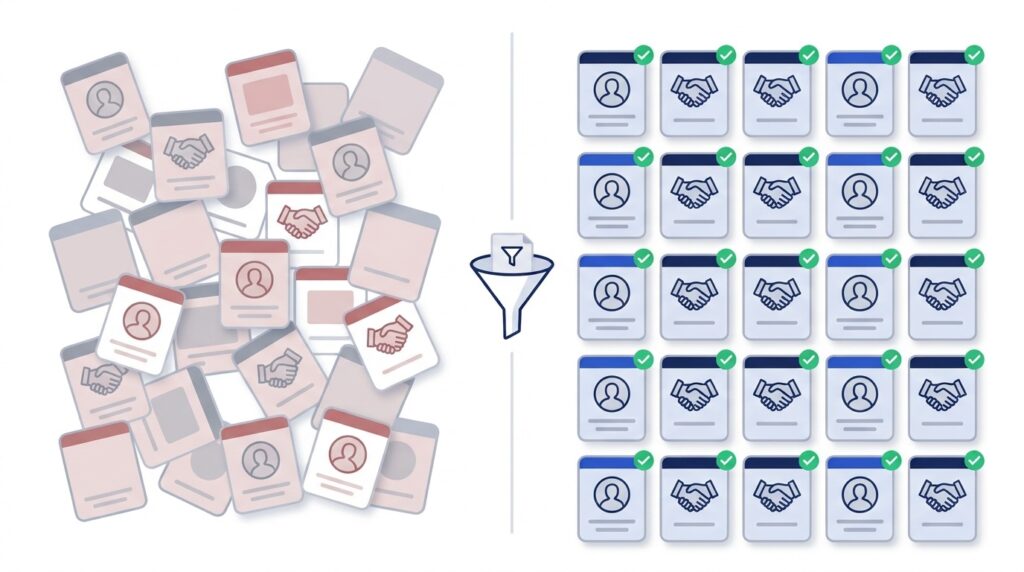
A dashboard doesn’t clean bad data. It displays it faster. Spend fifteen minutes in Zoho CRM scanning the Deals module for the problems that quietly wreck sales reports:
- Deals with no amount. They vanish from revenue charts or show as zero.
- Open deals with closing dates in the past. They inflate your pipeline and make forecasts meaningless.
- Inconsistent stage names or abandoned stages. Two stages that mean the same thing split one bar into two.
- Missing deal owners. Rep-level reports end up with a mysterious blank row.
- Blank lead sources. Source reports tell you very little if half the records have no source. If that sounds familiar, see our guide to adding and using Lead Source in Zoho CRM.
Fix these in Zoho CRM itself, not in Analytics. Zoho’s connector documentation notes that synced CRM tables can’t be edited directly in Analytics, although you can add formula columns and aggregate formulas for calculations. The same page covers combining CRM data with data from other sources when you’re ready.
If you find the same mess month after month, the real fix is usually a required field or a validation rule, which is where good workflow rules earn their keep.
Step 4: Build your first sales reports
Once the sync completes, open the workspace Zoho created for your CRM data. To start a new report, click Create and pick a report type: Chart, Pivot, Summary or Tabular View. Then choose the Deals table and drag columns into the report’s axes and filters.
Build these four in order. Each one answers a different question, and together they cover most of what a sales manager needs.
Report 1: Open pipeline by stage
Question it answers: Where is our money sitting right now?
- Table: Deals
- X axis: Stage
- Y axis: Amount (sum)
- Filter: exclude Closed Won and Closed Lost
- Chart type: funnel or horizontal bar
Look for stages where value piles up. A fat Negotiation bar with a thin Proposal bar behind it suggests a stalled middle of the funnel. A thin top suggests next quarter’s problem is already forming.
Report 2: Closed-won revenue by month
Question it answers: Are we actually closing, and is it trending the right way?
- Table: Deals
- X axis: Closing Date, grouped by month
- Y axis: Amount (sum)
- Filter: Stage equals Closed Won
- Chart type: column or line
If you have a monthly target, add it as a reference line or a second series so the gap is visible at a glance.
Report 3: Win rate
Question it answers: Of the deals we finish, how many do we win?
Win rate is the number of Closed Won deals divided by the total of Closed Won plus Closed Lost deals. Create it with a formula or aggregate formula on the Deals table and display it as a KPI widget. Be explicit about the definition on the dashboard itself. Some teams count only deals that reached a certain stage, others count everything, and arguments about the number are common when the definition is hidden.
Report 4: Pipeline by deal owner
Question it answers: Who is carrying the pipeline, and who needs help?
- Table: Deals
- X axis: Deal Owner
- Y axis: Amount (sum)
- Group or stack by: Stage
- Chart type: stacked bar
Use this one for coaching rather than ranking. A rep with a large pipeline stuck in early stages needs a different conversation than a rep with a small pipeline close to signature.
Optional fifth report: Lead source performance
If your Lead Source field is reliable, a bar chart of closed-won revenue by lead source shows which channels deserve more budget. If it isn’t reliable yet, skip this report and fix the field first.
Step 5: Combine your reports into a dashboard
With four reports saved, you can build the dashboard:
- Click Create and choose Dashboard.
- Drag your saved reports onto the canvas.
- Arrange them from summary to detail: KPI widgets (win rate, total open pipeline) across the top, trend charts in the middle, breakdowns by stage and owner underneath.
- Add user filters if you want viewers to slice by date range, owner or region.
- Give the dashboard a plain title, such as Sales Pipeline Overview, and save it.
A few layout habits make the difference between a dashboard people open daily and one they ignore:
- Five to seven widgets is plenty. Past that, nobody knows where to look.
- Use titles that state the question or the metric, not the chart type.
- Keep colors consistent. If Closed Won is green on one chart, it should be green everywhere.
- Put the most important number top left. That’s where people look first.
Step 6: Share it and schedule it
A dashboard nobody sees doesn’t help anyone. Zoho’s CRM help explains that you can share Analytics reports with other CRM users, including other administrators, from the CRM Reports database inside Zoho Analytics. Share with the people who will use it, and set permissions deliberately. A sales rep doesn’t usually need edit access to the manager’s dashboard.
Then make it hard to forget:
- Schedule an email. Zoho’s sales dashboard page lists scheduled email reports as a feature, so Monday’s pipeline summary can land in the team’s inbox before the meeting starts.
- Embed it where people already work. Zoho notes you can embed live dashboards in your CRM, intranet or client portal, which suits teams that live in one tab.
- Make the dashboard the agenda. Run your weekly pipeline review from the screen. Once the meeting depends on it, the data quality improves because people don’t like being wrong in public.
Step 7: Keep it accurate over time
A dashboard is a living thing. Four habits keep it trustworthy:
- Match your sync schedule to how the team works. If reps update deals throughout the day and you review at 9 a.m., a daily sync might be fine. If leaders check mid-day, shorter intervals matter. Check which options your plan allows.
- Show the last sync time. Zoho’s connector documentation mentions a last-sync status and time, which stops arguments about whether a number is current.
- Name an owner. One person is responsible for definitions, filters and changes.
- Review quarterly. Delete widgets nobody uses. Add the one question people keep asking in meetings.
Seven sales KPIs worth tracking
| KPI | What it tells you | Typical CRM fields | Best chart |
|---|---|---|---|
| Open pipeline value | How much potential revenue is in play | Amount, Stage | Funnel or bar |
| Closed-won revenue | What you actually booked | Amount, Closing Date, Stage | Column or line |
| Win rate | How efficiently you convert finished deals | Stage (won and lost counts) | KPI widget |
| Average deal size | Whether deals are growing or shrinking | Amount, Stage | KPI widget or line |
| Sales cycle length | How long deals take from creation to close | Created Time, Closing Date | Column or box-style summary |
| Lead source performance | Which channels produce real revenue | Lead Source, Amount, Stage | Bar |
| Pipeline by owner | Workload and coaching needs | Deal Owner, Amount, Stage | Stacked bar |
Common mistakes to avoid
- Building a wall of charts. More widgets mean less attention per widget. Start with four.
- Leaving definitions vague. Write down what counts as a qualified lead, an open deal and a win. Put the definitions on the dashboard.
- Charting dirty data. If amounts, stages or owners are inconsistent, fix the CRM first.
- One dashboard for everyone. Executives, managers and reps ask different questions. Build a second view once the first one is working.
- Skipping the process work. If your pipeline stages don’t reflect how deals really move, reports will mislead. Our Zoho CRM implementation roadmap covers how to set stages up properly.
- Forgetting permissions. Because CRM-based reports start out visible only to the admin who set them up, new dashboards often look empty to everyone else until sharing is configured.
Prebuilt dashboards or custom ones?
Zoho’s connector comes with a large library of prebuilt reports and dashboards, and they’re a sensible starting point. Open them, see which ones match questions your team already asks, and use them as templates. Then build your own for the metrics that reflect your actual process. Most teams end up with a hybrid: a few prebuilt views kept as they are, and a couple of custom dashboards shaped around their stages, territories or products.
What does it cost?
Zoho Analytics pricing is tiered, and published figures vary between third-party sites depending on billing period, add-ons and when the page was last updated. Rather than quote a number that may be out of date by the time you read this, we recommend checking Zoho’s pricing page directly and starting with the trial. If you’re budgeting for the wider Zoho stack, including implementation and customization, our Zoho customization cost estimator can help you plan.
When to bring in a Zoho consultant
You can build your first dashboard yourself. Consider outside help when:
- Your data lives in several systems (CRM, accounting, support) and you want one view across all of them.
- You need calculated metrics, such as weighted pipeline or cohort-style reports, that go beyond simple drag-and-drop.
- Sync issues, duplicate records or inconsistent fields keep undermining the numbers.
- Different teams need different dashboards, each with the right permissions.
- You want the dashboards tied to automation, so that a number moving past a threshold triggers a task or alert.
That’s the kind of work our Zoho Analytics and reporting service covers, from connecting data sources to designing dashboards that people use. If you’re not sure where to begin, a free consultation is a low-pressure way to get a second opinion on your setup
Frequently asked questions
How do I create a dashboard in Zoho Analytics?
Click Create, choose Dashboard, drag your saved reports onto the canvas, arrange them, add filters if needed, name the dashboard and save. You need at least a few reports built first, ideally from synced Zoho CRM data.
Can Zoho Analytics connect to Zoho CRM?
Yes. Zoho offers an Advanced Analytics connector for Zoho CRM that syncs the modules and fields you choose and includes prebuilt reports and dashboards. An administrator typically sets it up from the Reports tab in Zoho CRM.
How often does Zoho Analytics sync with Zoho CRM?
You choose a schedule during setup. Zoho’s documentation lists options such as every 3, 6 or 12 hours, or daily, with the Basic edition limited to daily syncs. Available options depend on your plan.
Is Zoho Analytics free?
Zoho offers a trial of the CRM analytics add-on, and some sources describe a limited free tier. Plan details change, so confirm what’s currently included on Zoho’s own pricing page.
Do I need to know how to code to build a sales dashboard?
No. Zoho Analytics uses a drag-and-drop builder, and the sales reports in this guide don’t need scripting. Custom formulas help for metrics such as win rate, but the basics are point and click.
Why can’t my team see the dashboard I built?
Reports created from the CRM connector are initially accessible only to the administrator who configured it. Share the dashboard with the right users from Zoho Analytics and check their permissions.
Conclusion
Your first Zoho Analytics dashboard doesn’t need to be impressive. It needs to be accurate, focused and used. Connect Zoho CRM, clean up the handful of fields that matter, build four reports that answer real weekly questions, and put them on one page your team looks at every Monday. Once that habit is in place, adding new sources, KPIs and views is easy.
If you’d like help getting the data connected and the dashboard designed around your sales process, the ZillTech team is happy to take a look.